
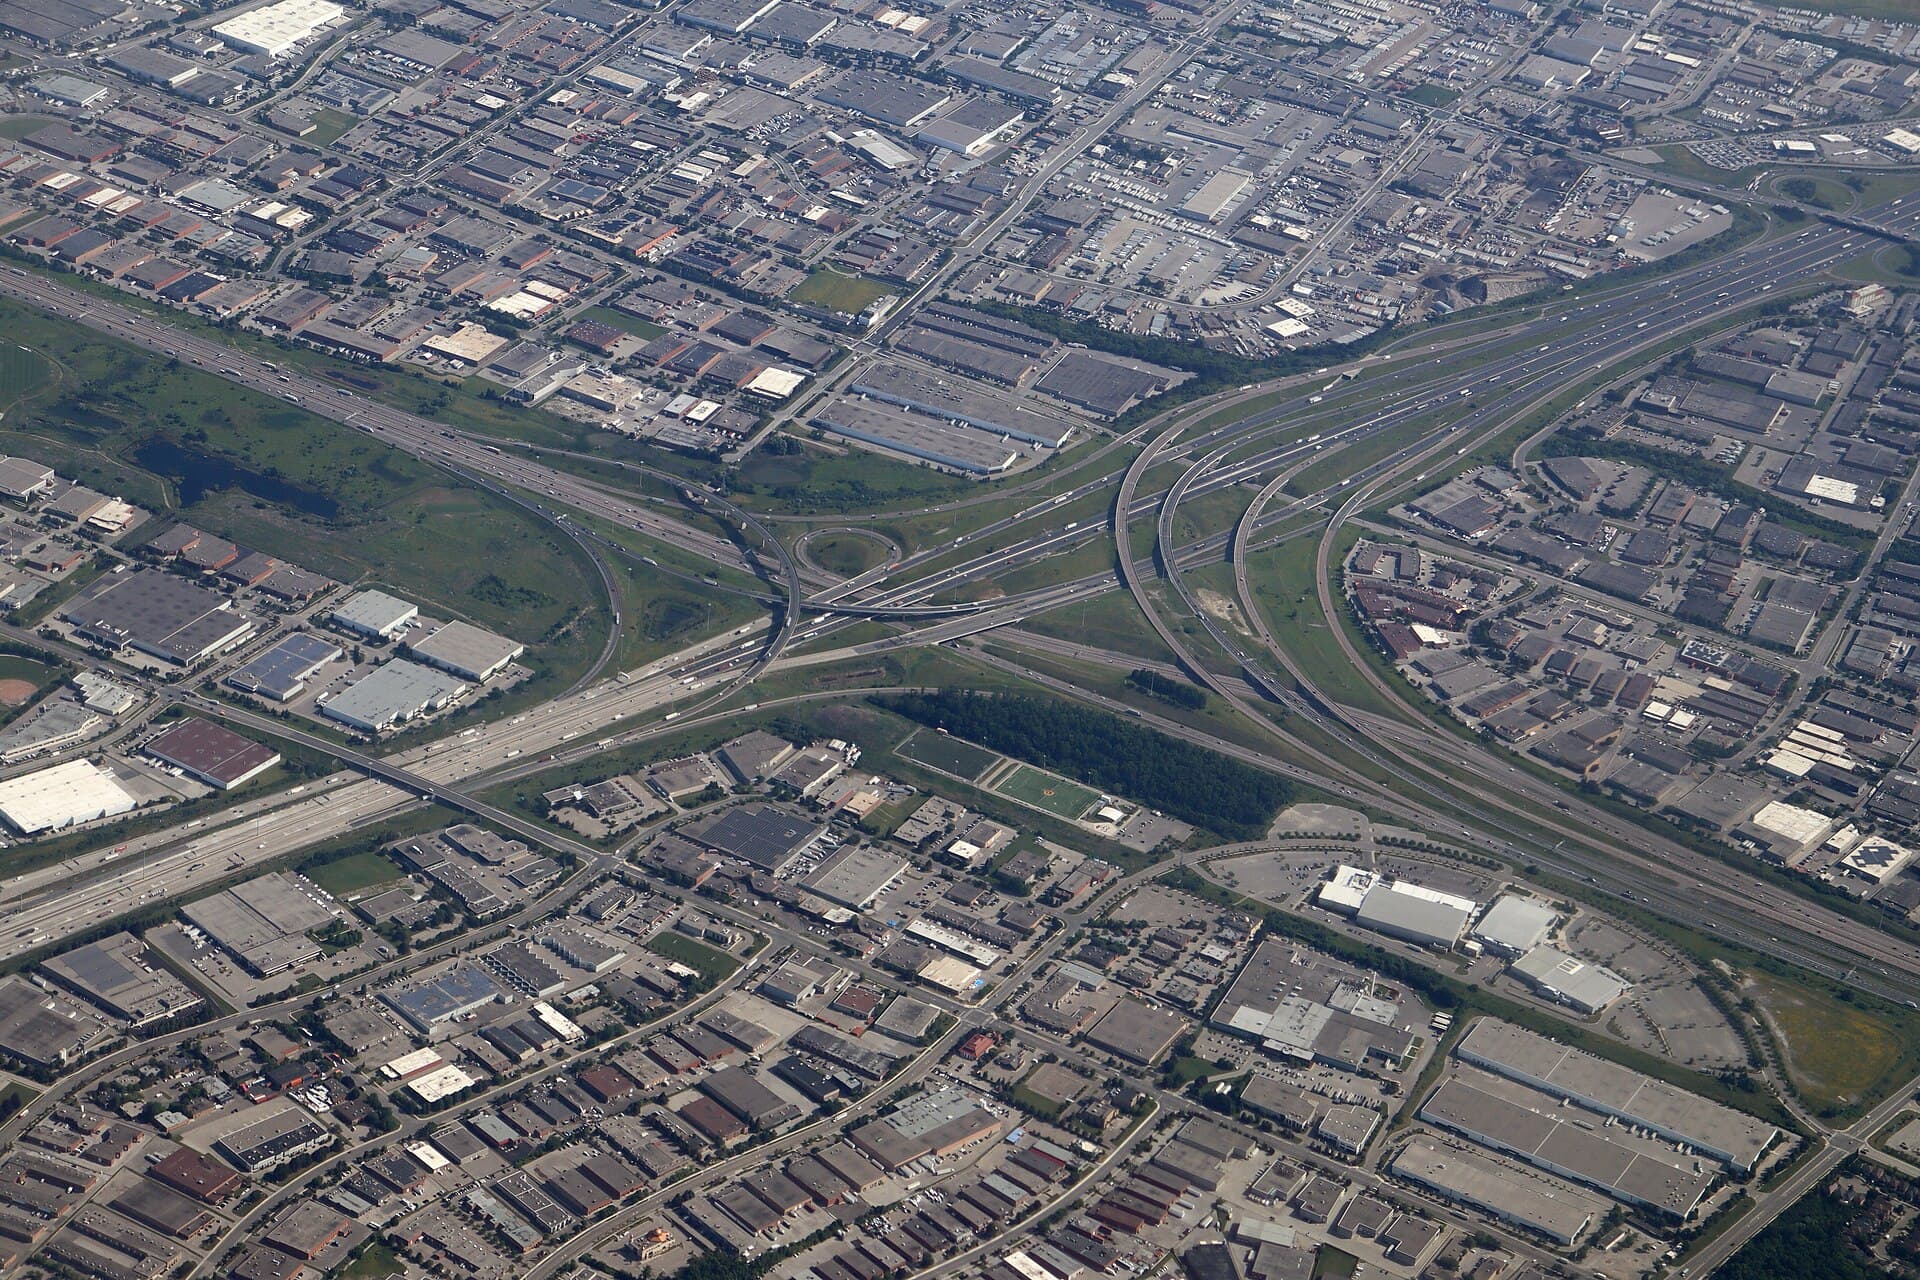
Bridges and highways
Structural condition without a lane closure, deterioration expressed as a rate, and a network ranked by what it costs to leave alone.
Looking at a bridge means closing a lane
Highway structures are inspected on a statutory cycle by people who need an under-bridge unit, a rope team or a traffic management plan to get close to the thing they are inspecting. That makes inspection expensive, disruptive and therefore rare, and it makes the interval a budget decision dressed as an engineering one. The result is a network where the condition of any individual structure is known precisely on the day it was inspected and estimated for the several years afterwards, and where the ranking between structures — which is the decision that actually allocates money — is made by comparing reports written by different people in different years.
Four failure modes, and what each one costs you late
Two of these close a road and two of them cost a fortune quietly. All four are currently assessed on an interval set by how hard the asset is to reach.
Deck and soffit deterioration
- How it shows
- Delamination, spalling, exposed and corroding reinforcement, leaching and staining
- What it costs late
- Load restriction or closure, on a route that may have no diversion
- What catches it
- Close-range capture of the soffit without an under-bridge unit, compared against the last pass
Bearing and joint failure
- How it shows
- Seized or displaced bearings, joint leakage staining the substructure below
- What it costs late
- A leaking joint quietly destroys the pier it drains onto, and that repair is an order of magnitude larger
- What catches it
- Capture that reaches the bearing shelf and traces the staining to the joint above it
Scour and substructure undermining
- How it shows
- Bed lowering at piers and abutments, exposed foundations, debris rafting
- What it costs late
- The failure mode that drops bridges in floods, usually with no warning at deck level
- What catches it
- Waterway and abutment survey after flood events rather than on a calendar
Pavement deterioration
- How it shows
- Cracking, rutting, ravelling, drainage failure, edge deterioration
- What it costs late
- Intervene late and a resurface becomes a reconstruction
- What catches it
- Network-level survey often enough that the deterioration rate is known per section
Severity here is how we rank the class by default, not a judgement about your site. Every threshold is set per deployment, and a mode you consider routine can be dropped down the ranking on day one.
Six functions, on your network
Everything above is your problem. These six are ours: what the layer actually does to a stock of structures and the road between them.
Reach the structure without closing it
Soffits, bearing shelves, pier tops and parapets captured close-range from the air, which is the difference between an inspection that costs a traffic management plan and one that does not.
Express defects as a rate
The same defect measured against the same defect on the previous pass, so the answer is how fast it is growing rather than how big it is today.
Survey pavement at network level
Cracking, rutting and drainage condition per section across the whole route, captured on the same pass as the structures.
Rank by consequence of closure
A deteriorating structure on a route with no diversion outranks a worse one with an easy detour. Consequence, not condition alone, is what a programme should be built on.
Plan work around the road
Findings tied to what access each repair actually needs, so the programme is grouped by closure rather than by structure and one lane closure does five jobs.
Hold the structure file
Inspections, findings, assessments and completed work against the structure, so the next inspection starts from a measured history.
A soffit patch whose growth curve has turned upward
Delamination on a 1974 deck is not news. That the affected area went from twenty-two square metres to forty-one to seventy-four across three surveys is a different statement entirely.
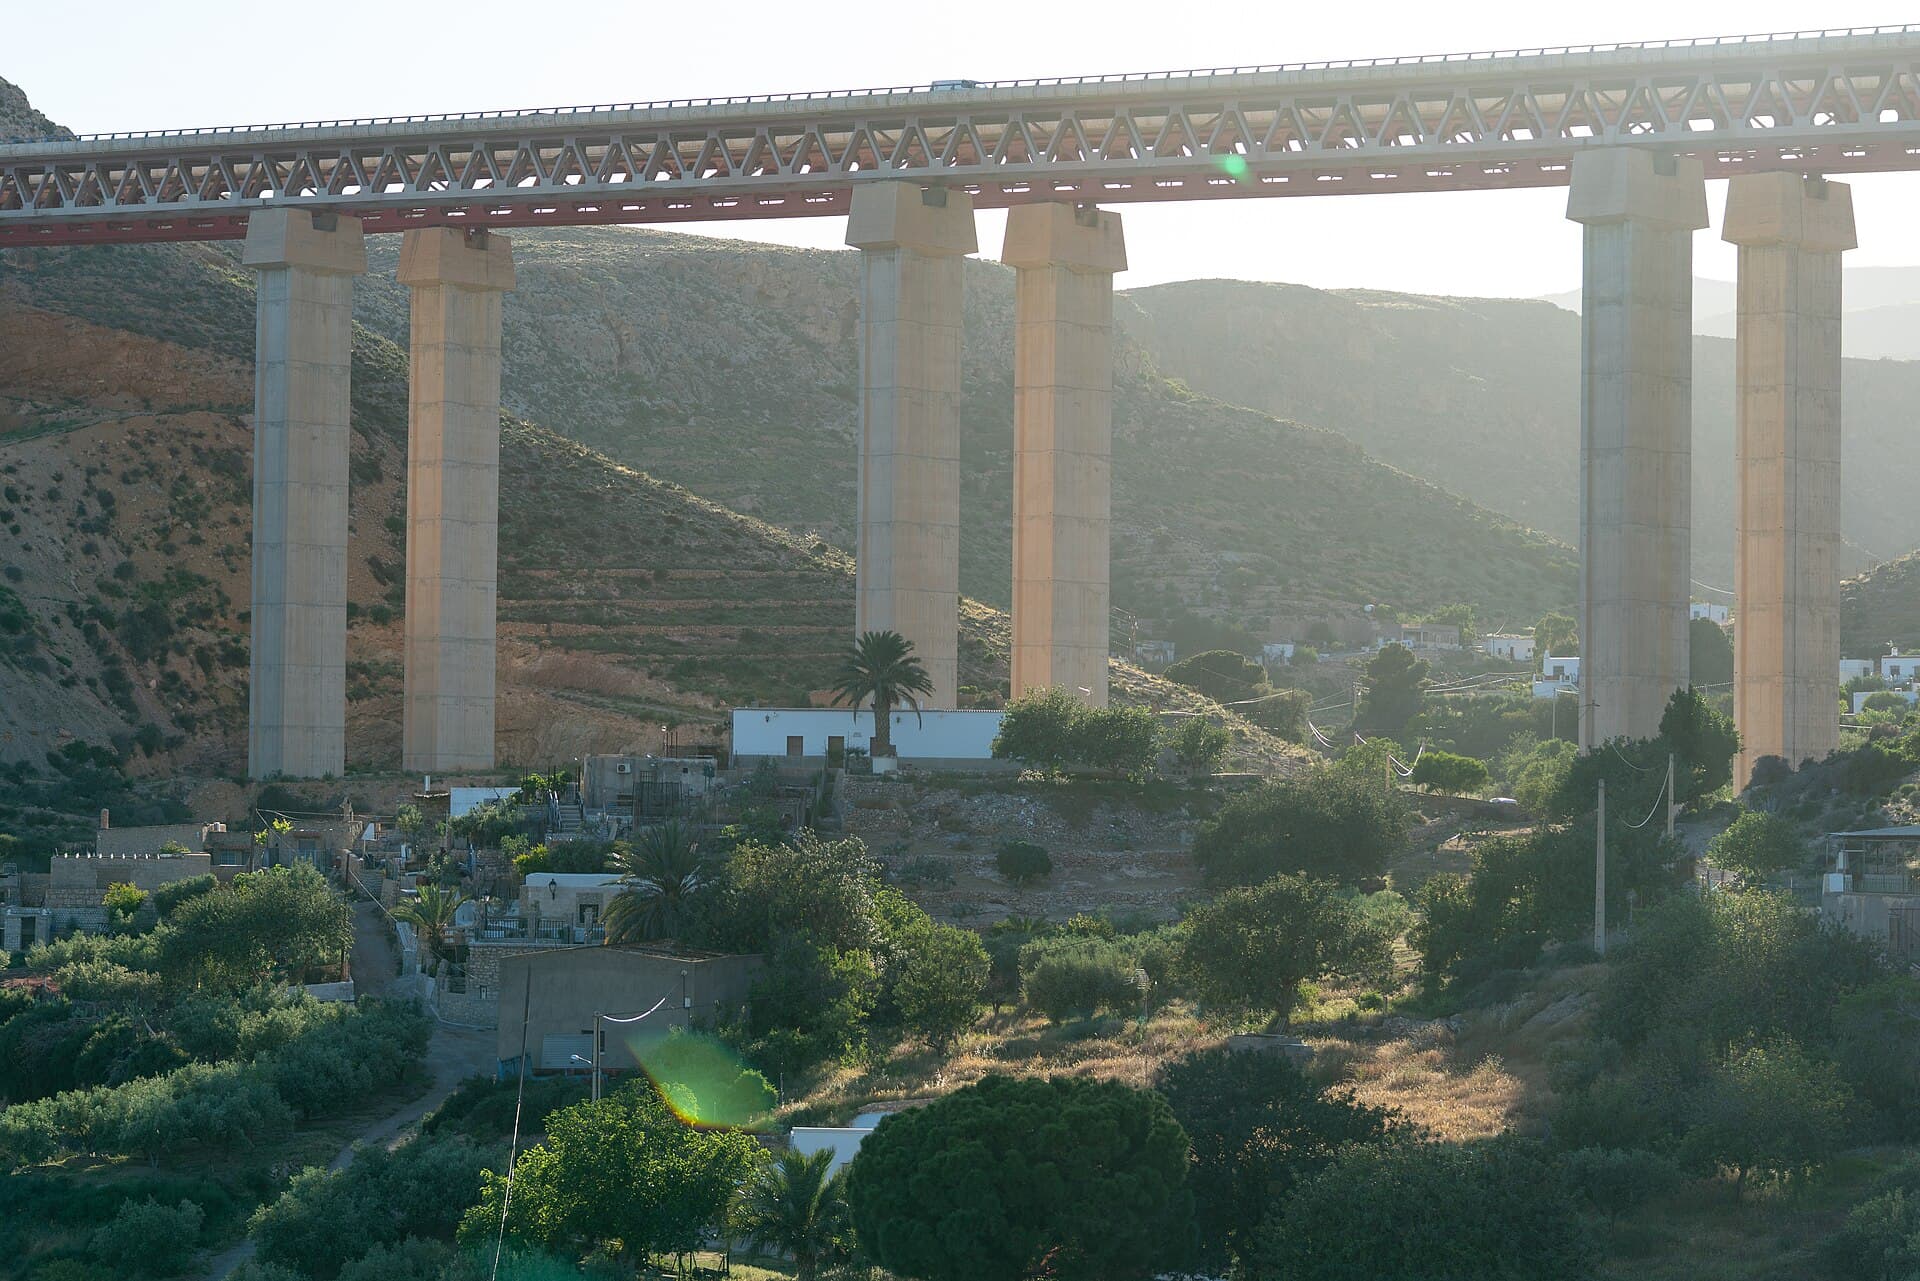
Soffit delamination spreading on span 3
Route 14 · bridge 14/07 · span 3
- this survey
- 74 m²
- previous
- 41 m² (2024)
- confidence
- 0.91
- diversion
- None available
Escalated to the structures engineer
Structural assessment is above the autonomy limit. The escalation carried the three surveys, the growth rate and the fact that this route has no diversion, which is what moves it up a programme.
Identifiers and values are illustrative.
From one route to the network
It starts on a route rather than a structure, because the argument here is comparative and a single bridge cannot demonstrate a ranking.
Connect the structures register
Read-only from your bridge management system for one route, so findings attach to structures that already exist in your record.
Fly the baseline
Every structure on the route plus the pavement between them, measured the same way in the same season, which for most networks is the first consistent comparison they have.
Run the cadence
Annually on structures and pavement, plus after flood events. The growth rate between passes is the product.
Widen across the network
Classes, ranking rules and access categories are agreed. The next route is scheduling.
Six things that land on your side
Artefacts, not access. Everything here exists in your systems and your formats whether or not anybody opens ours.
Structure condition survey
Every element with condition, extent, date and the frame it was assessed from.
PDF · CSV
Defect growth report
Each defect against itself on previous passes, expressed as a rate.
CSV · dashboard
Ranked programme
Structures ordered by deterioration rate and consequence of closure, with evidence per line.
CSV · BMS
Pavement condition
Cracking, rutting, ravelling and drainage per section across the route.
GeoTIFF · CSV
Measured model per structure
A current model of the structure for assessment and for repair design.
LAS · OBJ
Inspection evidence pack
Passes, findings, escalations and completed work exported with provenance intact.
PDF · ZIP
Formats are the common case; the exact shape is agreed per deployment.
How often, and what for
Statutory inspection cycles set the floor and nothing here proposes changing them. What changes is that between principal inspections the structure is no longer unobserved, and that the network is ranked on measurements taken the same way in the same year.
- Deck and superstructureTypical cadenceAnnual general, principal every 6 yearsWhat the pass looks forSoffit delamination and spalling, exposed reinforcement, parapet and edge conditionReferenceNBIS · DMRB CS 450
- Substructure and bearingsTypical cadenceAnnually, plus after flood eventsWhat the pass looks forPier and abutment condition, bearing position and corrosion, joint leakage, scourReferenceDMRB CS 450
- PavementTypical cadenceAnnually at network levelWhat the pass looks forCracking, rutting, ravelling, edge and drainage condition per sectionReferenceNetwork standard
- Ancillary assetsTypical cadenceAnnuallyWhat the pass looks forSigns, gantries, barriers, lighting columns, drainage, embankment conditionReferenceOperator standard
These intervals are the starting points the standards describe, not a measured result of ours. Insurers, warranty terms and your own history will move them, and the point of planning from condition is that the interval stops being the thing that decides.
Three modules, one network
Highway structures are surveyed and recorded, not instrumented. Where structural health monitoring exists it is on a handful of major crossings rather than on the stock, so three modules do the work here.
Detect
Flies decks, soffits, piers, bearings and the pavement, and measures each defect against the same defect on the last pass.
Leaves behind
Classified structural findings with extent, and pavement condition per section
Operations
Holds the structures register, the inspection history, the assessment record and the programme.
Leaves behind
The structure file, the work order and the evidence behind a programme decision
Decide & act
Ranks the network by rate of deterioration and consequence of closure, and escalates structural assessment rather than performing it.
Leaves behind
A ranked programme, and escalations with the growth history attached
- 01O-EYEDetectInspection & digital twin
- 02O-ARCAnalyseSensors, IoT & telemetry
- 03O-OPSOperationsThe system of record
- 04actsO-AGENTDecide & actThe agentic layer
Every action writes back to the record, so the model sharpens with every job.
Questions
Does this replace the principal inspection?
No. A principal inspection is a statutory, hands-on, signed engineering judgement and no aerial pass substitutes for it. What this changes is the years between them, and what the inspecting engineer has in front of them on the day.
Can a drone get under a bridge deck?
Under many, yes, with a suitably equipped aircraft and a pilot who does it regularly — that is exactly the case where it is worth the money, because the alternative is an under-bridge unit and a lane closure. Under some, in tight clearance or over fast water, no. We say which per structure rather than in general.
Do you detect delamination, or just see the surface?
Visual and thermal indications of delamination, which is a genuine detection and not the same thing as a hammer survey or GPR. It is good at telling you where to send those, and it is honest about being an indicator rather than a confirmation.
How does this help with the programme rather than one bridge?
That is the main point. Once every structure on a route has been measured the same way in the same year, ranking them by deterioration rate and consequence becomes arithmetic rather than a negotiation between reports written years apart.