
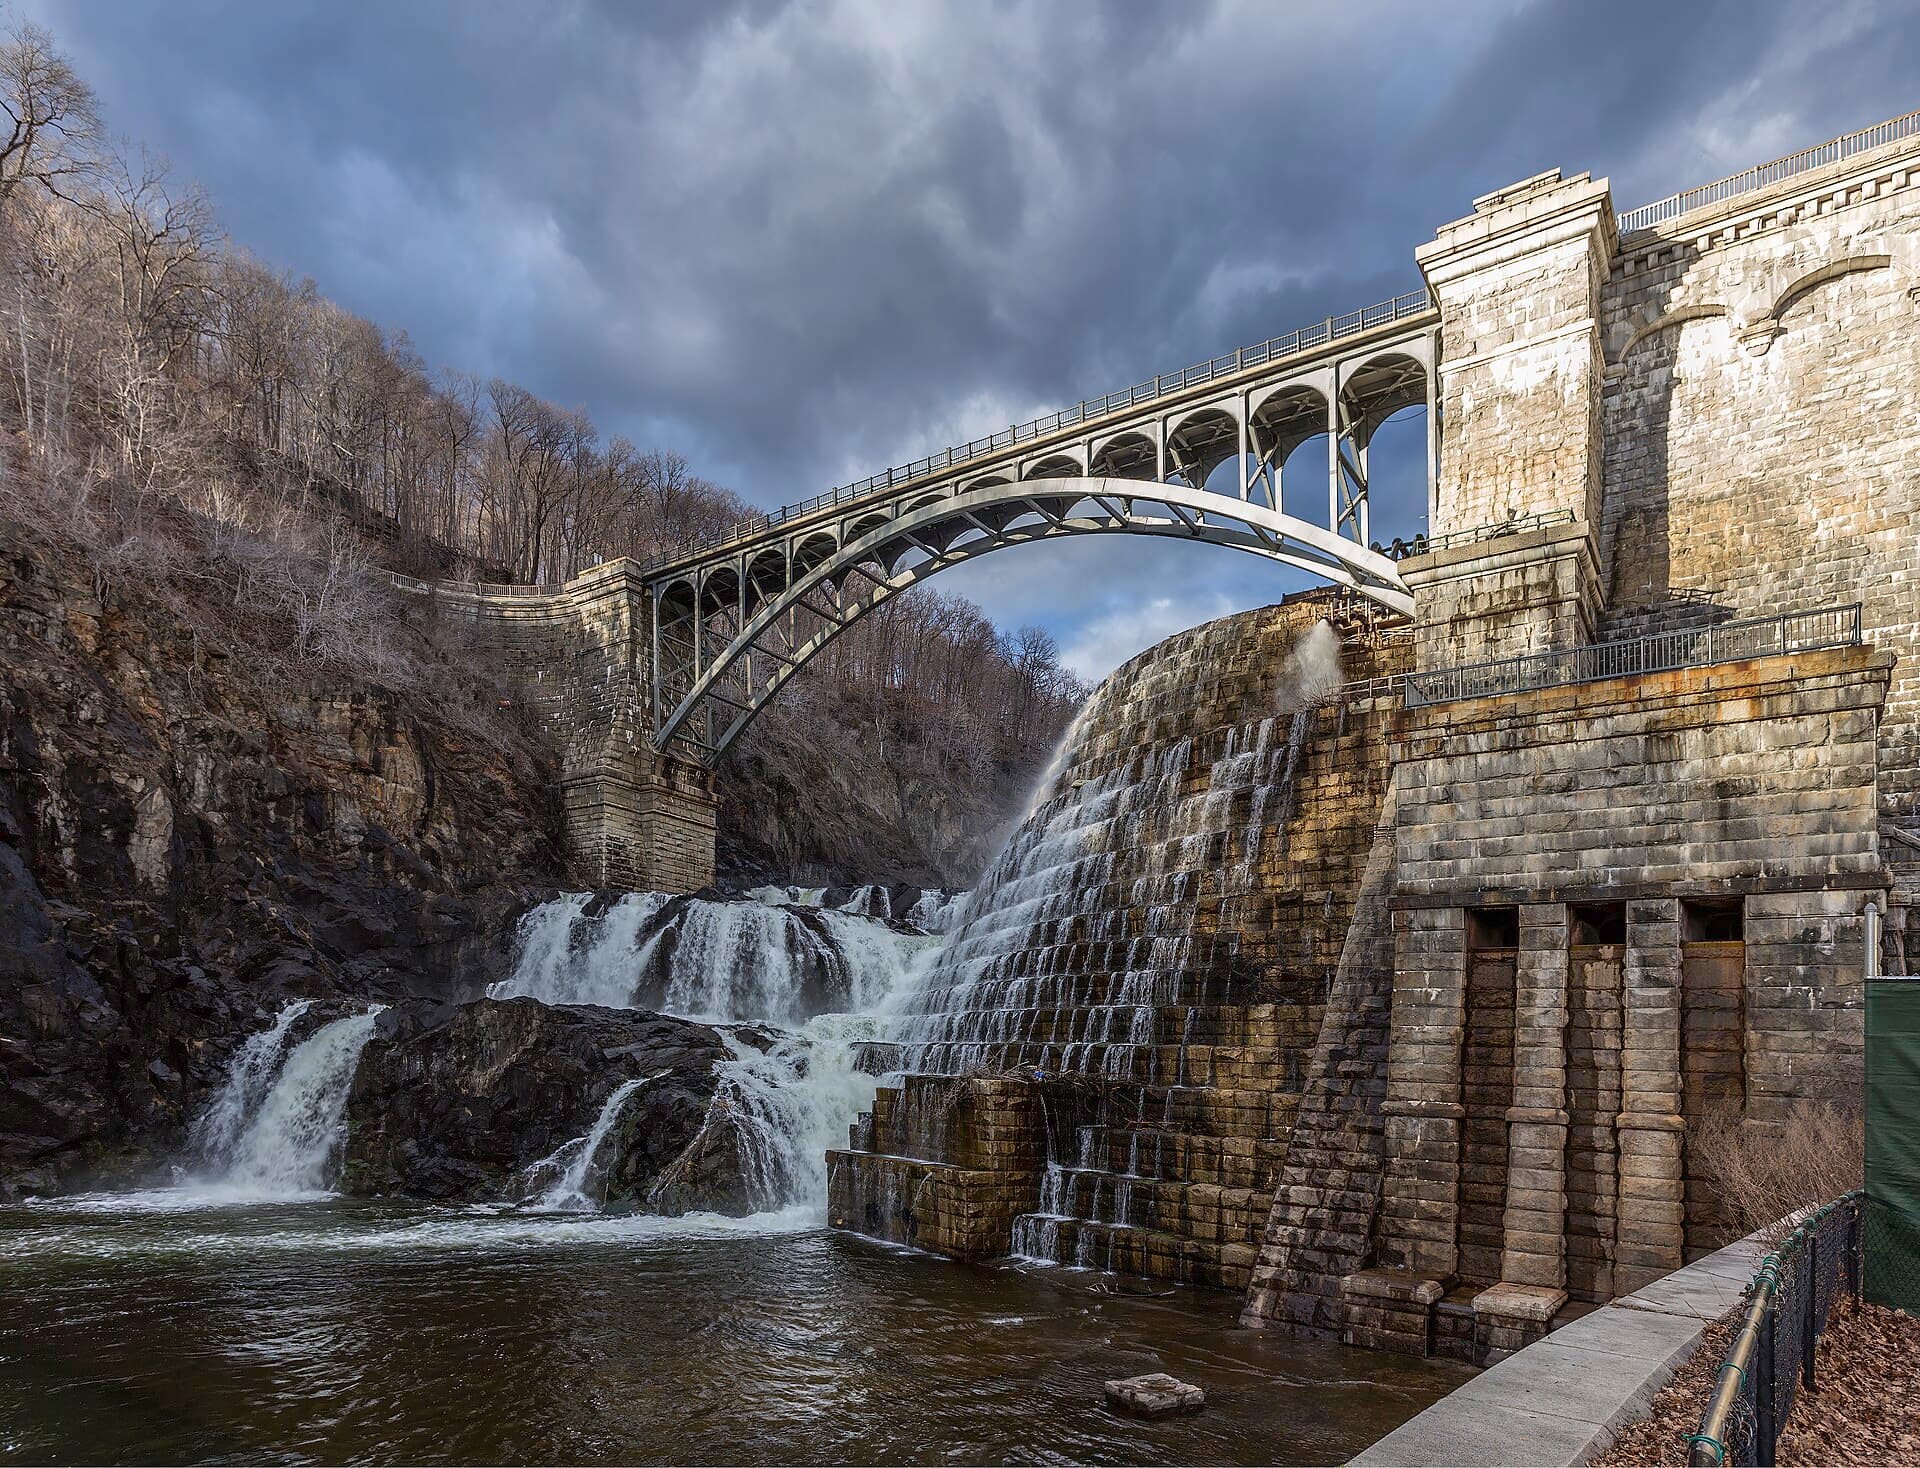
Hydro and dams
Structural condition and movement across the dam, the spillway and the waterway, held against the surveillance record a dam safety regulator asks to see.
The asset outlives everybody who understood it
A dam is a hundred-year asset inspected by people whose careers are thirty. The surveillance record is real — piezometers, drain flows, survey monuments, statutory inspection reports — and it is spread across instrument logs, a consultant’s PDF and the memory of the engineer who has looked after the scheme for twenty years. So the question a regulator actually asks, which is whether behaviour has changed, gets answered by comparing this year’s report to last year’s report rather than by comparing this year’s dam to last year’s dam.
Four failure modes, and what each one costs you late
The first two are the ones a dam safety regime exists for. The second two are ordinary asset management, and they are where most of the money actually goes.
Seepage and internal erosion
- How it shows
- Damp patches, efflorescence, drain flow rising, seepage responding faster to head
- What it costs late
- The failure mode that empties a valley, and the one every regulator is watching for
- What catches it
- Thermal and visual passes on the same face, read against drain flow and reservoir level
Spillway and gate deterioration
- How it shows
- Concrete spalling, cavitation damage, gate corrosion, seal and hoist wear
- What it costs late
- A spillway that cannot pass the design flood is a dam that cannot be operated safely
- What catches it
- Capture of the chute, stilling basin and gates when they are dry and reachable
Penstock and waterway degradation
- How it shows
- External corrosion, coating loss, support and anchor movement, leakage at joints
- What it costs late
- A penstock failure takes the station offline for a year, not a week
- What catches it
- Repeat aerial capture along the alignment, with movement measured pass over pass
Reservoir sedimentation and debris
- How it shows
- Delta advance, storage loss, trash rack blinding, bank instability
- What it costs late
- Generation capacity quietly lost, and an intake that blocks in the wrong storm
- What catches it
- Reservoir margins and intake approaches surveyed on a cadence rather than at drawdown
Severity here is how we rank the class by default, not a judgement about your site. Every threshold is set per deployment, and a mode you consider routine can be dropped down the ranking on day one.
Six functions, on your scheme
Everything above is your problem. These six are ours: what the layer actually does to a dam, a waterway and the station behind them.
Capture the face on a cadence
The downstream face, abutments and crest flown quarterly, including the parts reachable only by rope access or not at all.
Measure movement, not appearance
Crest and face position compared against the previous pass with a stated accuracy, so displacement is a number rather than a description in a report.
Read wetting against head
Damp patches and efflorescence tracked pass over pass and correlated with reservoir level and drain flow, so a changed response is visible as a change.
Follow the waterway
Penstock alignment, supports, anchors and coating captured along the full run, where the failure that matters is slow and the access is bad.
Join plant telemetry to the structure
Generation, bearing and transformer data bound to the machine and the building, so a station finding has the operating context behind it.
Build the surveillance file
Passes, findings, instrument trends and inspections held together, in the shape a dam safety submission expects.
Seepage that is responding faster than it did last year
Nothing here is outside a limit. Drain flow is up but within range, the piezometers are normal, and the block would pass an inspection today. The finding is that the lag has shortened.
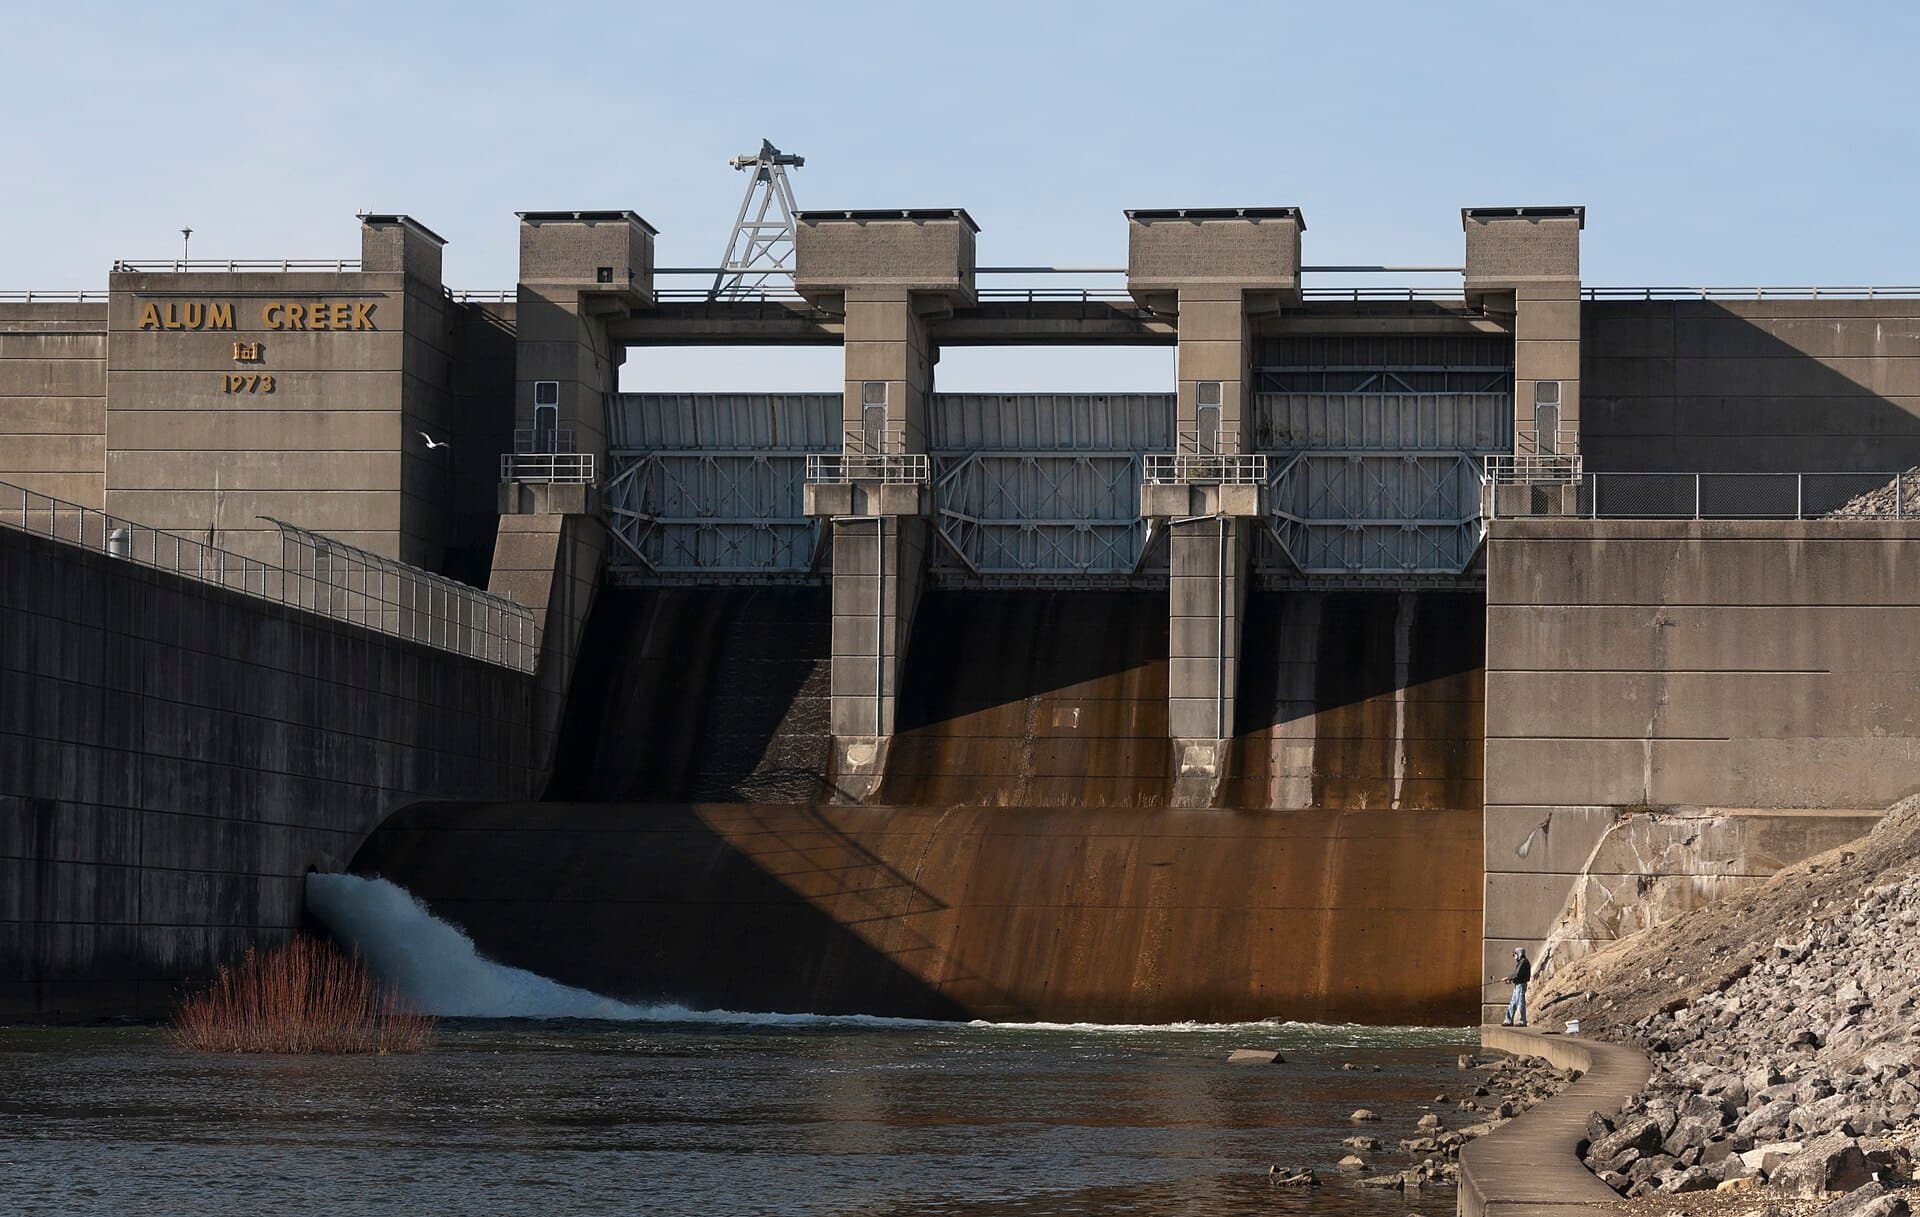
Damp patch and efflorescence, block 7
Upper scheme · dam · block 7
- extent
- 6.2 m² of the face
- confidence
- 0.89
- drain flow
- Up 18% on 5yr mean
- piezometers
- Within range
Escalated to the supervising engineer
Anything touching dam safety is above the autonomy limit and always will be. What the agent contributes is that the escalation arrived with four passes of the same face, the drain trend and the reservoir level at each capture.
Identifiers and values are illustrative.
From one dam to the cascade
It starts on one structure, because the argument here is entirely about comparison and the second pass is the first one worth anything.
Connect instrumentation and generation
Read-only from the dam instrumentation and the generation control system on one scheme. Nothing is written back until you ask for it.
Fly the baseline
One full pass over the dam, spillway, waterway and reservoir margins with ground control and a stated accuracy. Every block becomes an asset with a photograph, a date and its surveillance history attached.
Run the cadence
Quarterly on the dam, annually on the spillway and waterway, thermal twice a year on plant. Every pass from here is a comparison.
Widen across the cascade
Naming, classes and the escalation defaults are agreed. The next dam on the river is configuration.
Six things that land on your side
Artefacts, not access. Everything here exists in your systems and your formats whether or not anybody opens ours.
Dam face condition survey
Every block with condition, extent, date and the frame it was assessed from.
PDF · GeoTIFF
Movement report
Crest and face displacement per block against the previous passes, with a stated accuracy.
PDF · CSV
Seepage and thermal record
Wetting and thermal signature per block, correlated with reservoir level and drain flow.
PDF · CSV
Waterway condition
Penstock, supports, anchors and coating along the full alignment, versioned pass over pass.
GeoTIFF · PDF
Reservoir and intake survey
Margins, delta advance and intake approach condition against the previous survey.
LAS · GeoTIFF
Surveillance evidence pack
Passes, findings, instrument trends and inspections exported together with provenance intact.
PDF · ZIP
Formats are the common case; the exact shape is agreed per deployment.
How often, and what for
Statutory inspection intervals set the floor and nothing here proposes changing them. What this changes is the years in between, when the dam is doing exactly what it always does and nobody is measuring whether that has altered.
- Dam and abutmentsTypical cadenceQuarterly, plus after flood eventsWhat the pass looks forFace condition, seepage and efflorescence, crest movement, abutment and slope conditionReferenceICOLD · reservoir safety regulation
- Spillway and gatesTypical cadenceAnnually, and before flood seasonWhat the pass looks forChute and stilling basin concrete, cavitation, gate corrosion, seals, hoists, debrisReferenceICOLD
- Penstock and waterwayTypical cadenceAnnually, thermal on exceptionWhat the pass looks forExternal corrosion and coating, support and anchor movement, joint leakage, alignmentReferenceManufacturer · scheme standard
- Powerhouse and plantTypical cadenceThermal twice a yearWhat the pass looks forGenerator, transformer and switchgear hotspots, bearing condition, building envelopeReferenceNFPA 70B
These intervals are the starting points the standards describe, not a measured result of ours. Insurers, warranty terms and your own history will move them, and the point of planning from condition is that the interval stops being the thing that decides.
Four modules, one scheme
A hydro scheme is one of the best-instrumented assets in infrastructure and one of the worst-joined. The instruments know the numbers and nothing holds them next to what the concrete looks like.
Detect
Flies the dam face, the spillway, the waterway and the reservoir margins, and measures movement against the previous pass.
Leaves behind
Classified condition findings and displacement per block, per section
Analyse
Connects to generation control, dam instrumentation and the drain and piezometer record, and resolves each onto a part of the structure.
Leaves behind
Head, drain flow, piezometric and generation history readable per block
Operations
Holds the asset register, the surveillance record, the statutory inspection history and the evidence.
Leaves behind
The surveillance file, the work order and the regulator’s evidence pack
Decide & act
Reads the three together and escalates anything touching dam safety to a named engineer rather than scheduling it.
Leaves behind
Escalations with the frames, the trend and the surveillance history attached
- 01O-EYEDetectInspection & digital twin
- 02O-ARCAnalyseSensors, IoT & telemetry
- 03O-OPSOperationsThe system of record
- 04actsO-AGENTDecide & actThe agentic layer
Every action writes back to the record, so the model sharpens with every job.
Questions
Does this replace the statutory inspection?
No, and it could not. A supervising or inspecting engineer forms a judgement and signs it, and that is a legal role no software occupies. What this does is hand that engineer four passes of evidence instead of a walk round on the day, and flag the change that would otherwise have waited for the next inspection.
Can it see seepage the eye cannot?
Thermal helps where seepage is cool against a warm face, and it is genuinely useful on a dry sunny afternoon in the right season. It is not a groundwater sensor and it does not see inside the structure. The value is repeat capture of the same face, not a single clever image.
Our instrumentation is already telemetered. What is added?
The join. Your system knows a drain flow against a channel number. It does not know that the channel drains block 7, that block 7 is the one with efflorescence on the last four passes, or that the response lag has shortened. Binding the instrument to the structure is the work.
Would an agent ever act on a dam safety finding?
No. Dam safety is escalated to a named engineer with everything it read attached, and that default is not configurable downward in any deployment we would agree to.