
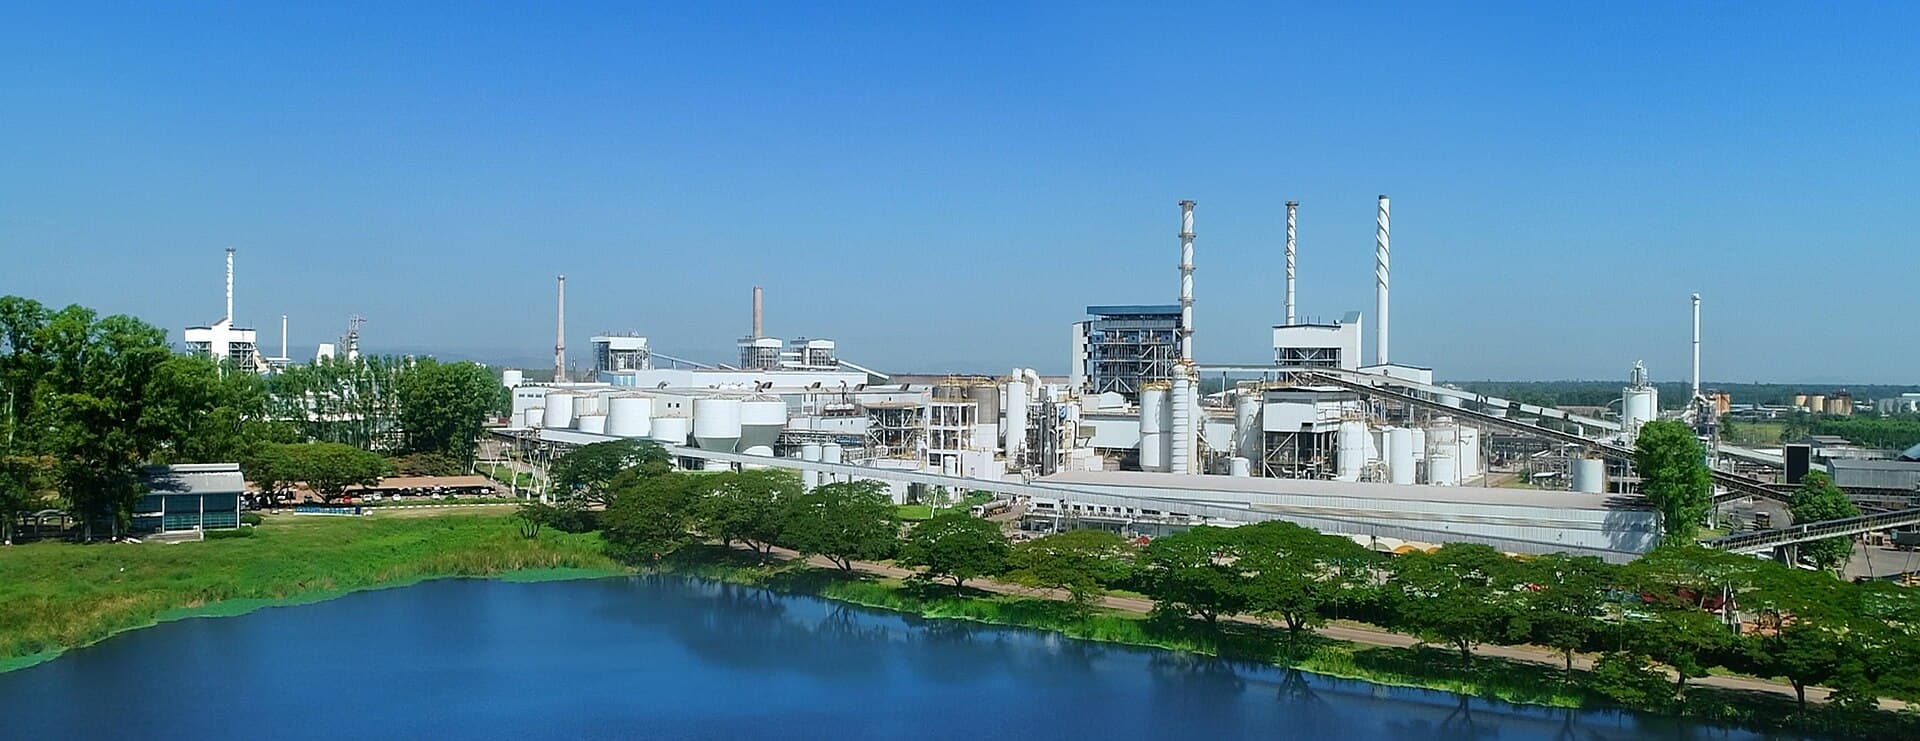
Manufacturing and process plants
Rotating plant, process lines and the building around them, read together so an outage is planned against condition rather than against the calendar.
The plant is instrumented for output, not for its own health
A process plant measures everything that affects the product and very little that affects the plant. The control system knows throughput, temperature and yield to four decimal places; it knows almost nothing about the condition of the machine producing them. Maintenance history lives in a CMMS that records what was done and not what was found. So the outage — the one window a year when anything can actually be opened up — is scoped from a list assembled by the people who shouted loudest, and the drive that was going to fail in month seven was not on it.
Four failure modes, and what each one costs you late
On a continuous plant every one of these is measured in lost production, which is why the interesting question is never whether to fix it but which window to fix it in.
Rotating plant failure
- How it shows
- Bearing temperature and vibration separating from identical machines on the same duty
- What it costs late
- An unplanned stop on a line that only makes money while it is moving
- What catches it
- Thermal at load read against peer machines, with the maintenance history attached
Steam, air and thermal losses
- How it shows
- Failed traps, insulation loss, leaks that nobody hears over the plant
- What it costs late
- Paid for continuously, invisible on any dashboard, rarely anybody’s job
- What catches it
- Thermal survey across pipe runs and the utilities plant, quantified per defect
Building and roof deterioration
- How it shows
- Roof and cladding failure, ponding, gutter and drainage blockage
- What it costs late
- Water onto a production line, and a shutdown caused by the building rather than the plant
- What catches it
- Aerial capture of roofs and plant decks over an operating works
Utilities and distribution decline
- How it shows
- Switchboard and transformer hotspots, compressor and chiller efficiency drift
- What it costs late
- The whole site is downstream of these, and they are inspected least
- What catches it
- Thermal on the electrical estate with load at capture, tied to the asset
Severity here is how we rank the class by default, not a judgement about your site. Every threshold is set per deployment, and a mode you consider routine can be dropped down the ranking on day one.
Six functions, on your works
Everything above is your problem. These six are ours: what the layer actually does to a working plant and the building around it.
Survey thermally at load
A thermal reading taken off load says almost nothing. Passes are planned around production so the machine is doing its job when it is measured.
Read machines against their peers
Six identical drives on one duty should behave identically. Reading one against five separates a failing machine from a hot day.
Capture roofs and plant decks
The parts of a works that shut down production when they fail and that nobody walks, surveyed from the air over an operating site.
Hold the plant register
Machine, duty, peer group, history and spares against the asset, so a finding arrives with everything already attached.
Scope the outage from condition
Work ranked into the next window by evidence and consequence, which is the artefact that decides where a year of maintenance budget goes.
Record what was found and done
Findings, thermal frames, jobs and sign-offs held together, so the next outage starts from a record rather than from memory.
A drive walking away from five identical neighbours
The reading is inside alarm. It has been inside alarm for eleven weeks while steadily separating from the five drives doing exactly the same job beside it.
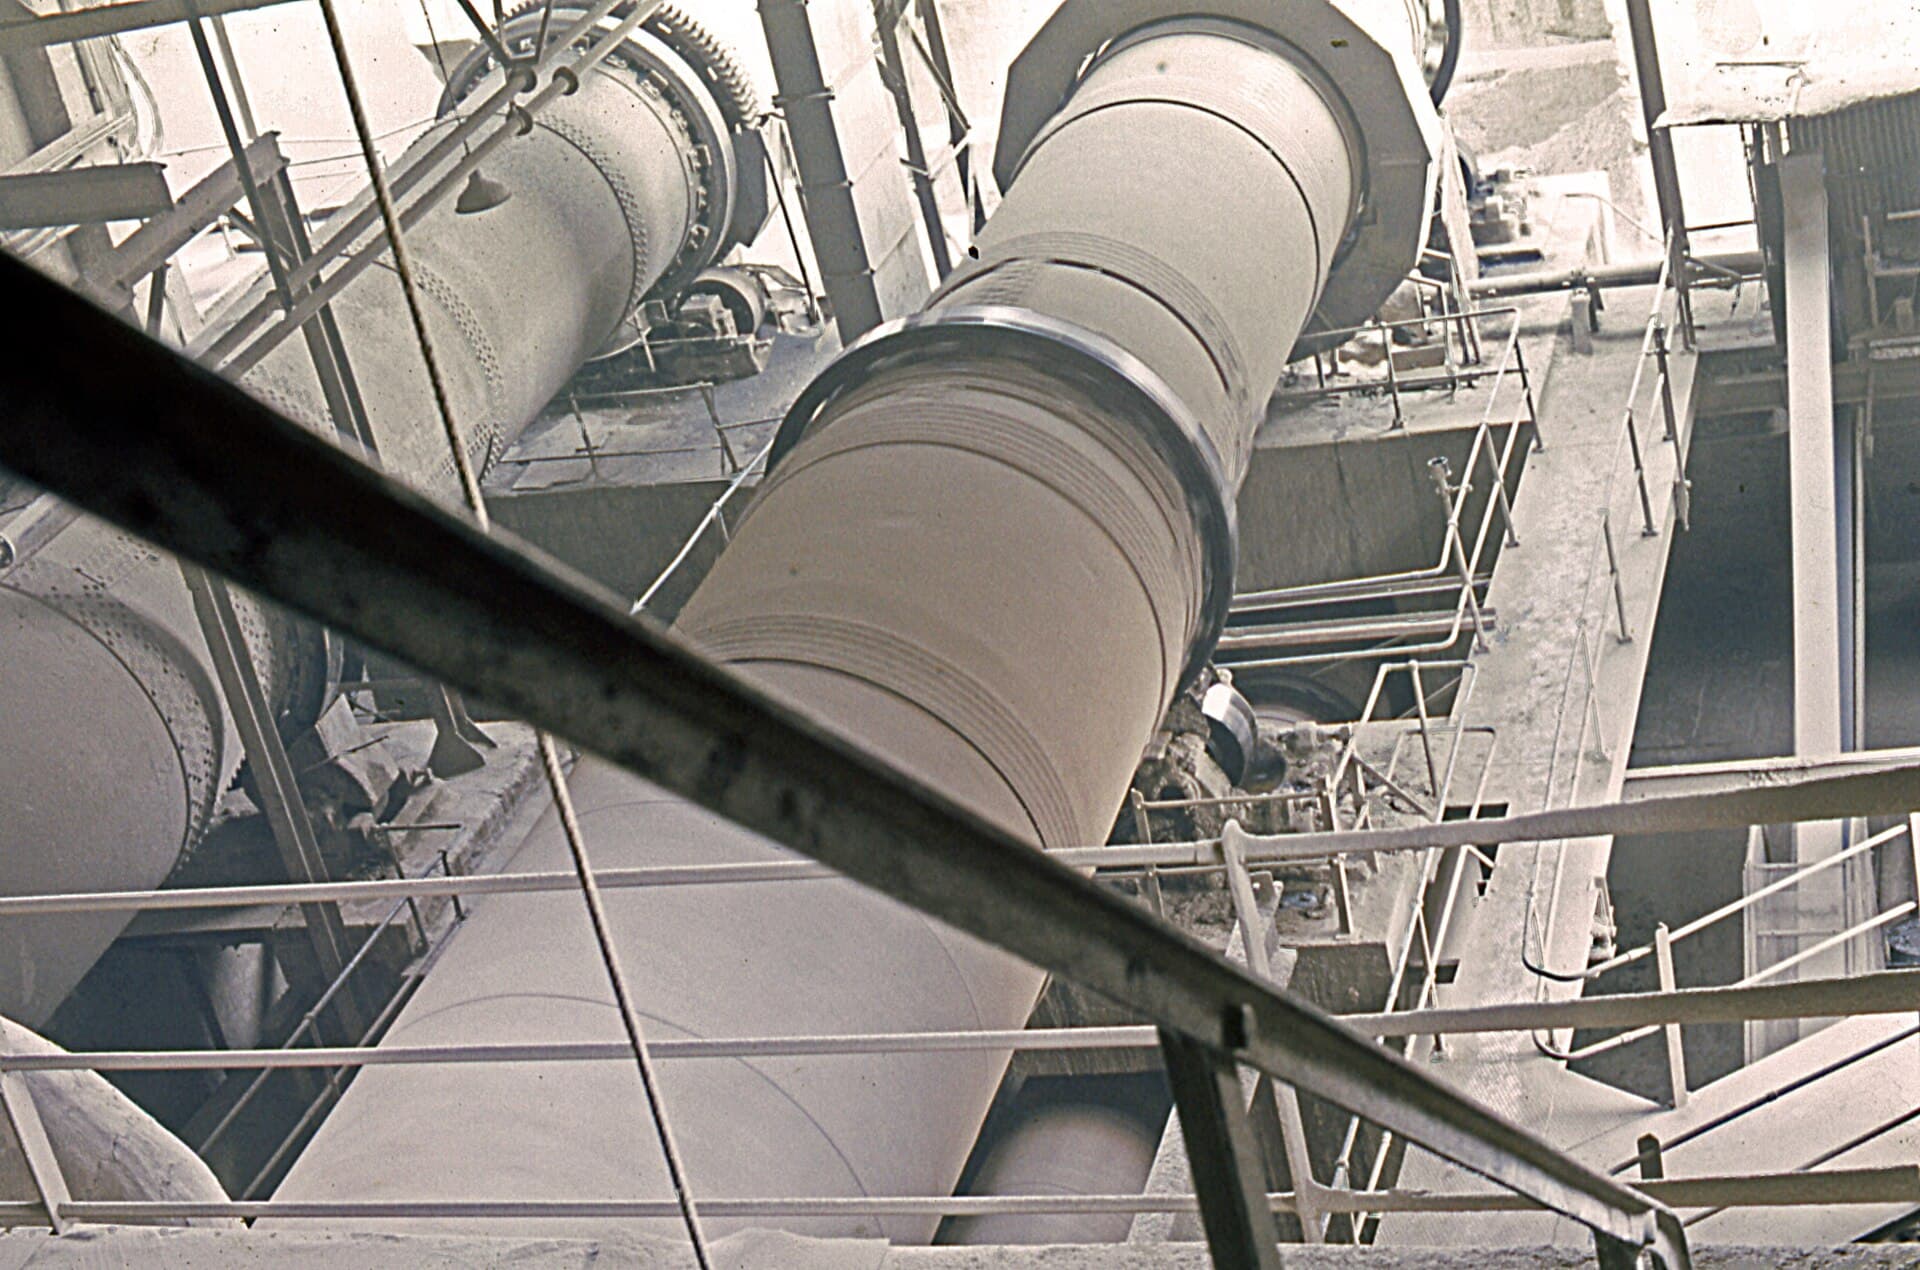
Drive end bearing running hot at load
Works 2 · line 2 · drive 4
- delta T
- 22 K over peers
- confidence
- 0.90
- drifting
- 11 weeks
- next outage
- 5 weeks
Added to the outage scope with the part on order
Inside the autonomy limit because it schedules work into a window that already exists and orders a part already on the catalogue. It does not touch the running plant.
Identifiers and values are illustrative.
From one line to the site
It starts on a single line with identical machines on it, because peer comparison is the fastest thing to prove and the hardest thing to argue with.
Connect the control system
Read-only from the historian or control system for one line, plus the maintenance history for the machines on it.
Survey the baseline
A thermal and visual pass at load across the line, the utilities feeding it and the roof above it, with every machine bound to its peer group.
Run the cadence
Quarterly thermal at load, annual on the envelope. The drift between passes is what feeds the outage.
Widen across the site
Peer groups, classes and thresholds are set. The second line and the second works are configuration.
Six things that land on your side
Artefacts, not access. Everything here exists in your systems and your formats whether or not anybody opens ours.
Thermal survey report
Every machine with delta against its peer group and the duty at capture.
PDF · CSV
Peer deviation list
Machines separating from identical neighbours, ordered by rate of separation.
CSV · dashboard
Outage scope
Ranked work for the next window, with the evidence and the part against every line.
CSV · SAP · Maximo
Building and roof survey
Roofs, cladding, gutters and plant decks with condition and the frame behind each finding.
PDF · GeoTIFF
Utilities thermal report
Switchboards, transformers and busbars with load at capture attached.
PDF · CSV
Maintenance evidence pack
Findings, frames, jobs and sign-offs exported together with provenance intact.
PDF · ZIP
Formats are the common case; the exact shape is agreed per deployment.
How often, and what for
Everything here is arranged around the outage. The point of surveying more often than you can intervene is that when the window opens, its scope is decided by evidence rather than by whoever asked first.
- Rotating plantTypical cadenceThermal quarterly, at loadWhat the pass looks forBearing, coupling and drive hotspots against peer machines on the same dutyReferenceISO 14224
- Process lines and vesselsTypical cadenceThermal twice a yearWhat the pass looks forInsulation loss, trap failure, refractory hotspots, leaks, structure and accessReferenceManufacturer · site standard
- Buildings and roofsTypical cadenceAnnually, plus after severe weatherWhat the pass looks forRoof and cladding condition, ponding, gutters, plant decks, rooflightsReferenceISO 55001
- Electrical and utilitiesTypical cadenceThermal twice a yearWhat the pass looks forSwitchboard, transformer and busbar hotspots, compressor and chiller conditionReferenceNFPA 70B
These intervals are the starting points the standards describe, not a measured result of ours. Insurers, warranty terms and your own history will move them, and the point of planning from condition is that the interval stops being the thing that decides.
Four modules, one works
This is the sector where peer comparison does the most work, because a process plant is full of identical machines doing identical jobs — and almost nothing currently reads them against each other.
Detect
Surveys rotating plant, process lines, roofs and plant decks thermally and visually, at load.
Leaves behind
Classified thermal and condition findings against the machine and the building
Analyse
Connects to the control system and historian and resolves every tag onto the machine it belongs to.
Leaves behind
Current, vibration, temperature and duty history readable per machine and per peer group
Operations
Holds the asset register, the maintenance history, the spares and the outage plan.
Leaves behind
The work order, the outage scope and the evidence behind each line of it
Decide & act
Reads the three together and schedules into the next window rather than raising an alarm now.
Leaves behind
Outage scope with a reason and a part against every entry
- 01O-EYEDetectInspection & digital twin
- 02O-ARCAnalyseSensors, IoT & telemetry
- 03O-OPSOperationsThe system of record
- 04actsO-AGENTDecide & actThe agentic layer
Every action writes back to the record, so the model sharpens with every job.
Questions
Can you fly inside a working plant?
Indoors is limited and we will not overstate it. Where the space, the airflow and the safety case allow it, yes; in a hot, congested or classified area, no. Most of what this does indoors today is thermal survey on foot with the same asset model, and the aerial work is roofs, decks, stacks and the external plant.
We already have condition monitoring on the critical machines.
Then keep it — permanent vibration monitoring beats a quarterly pass on the machine it is fitted to. The gap it leaves is everything it is not fitted to, which on most sites is the great majority of the rotating plant, and that is where peer comparison earns its place.
Does this integrate with our CMMS or ERP?
Yes, and it should. Where SAP PM, Maximo or similar is your system of record, O-OPS reads from it and writes findings and completed work back through its API. The outage plan stays where your planners already work.
What accuracy do you claim on thermal readings?
Delta against a peer machine at the same duty, not an absolute temperature. Absolute thermography needs emissivity and distance control that an aerial or walking pass does not have, and a difference against five identical neighbours is the more useful number anyway.