
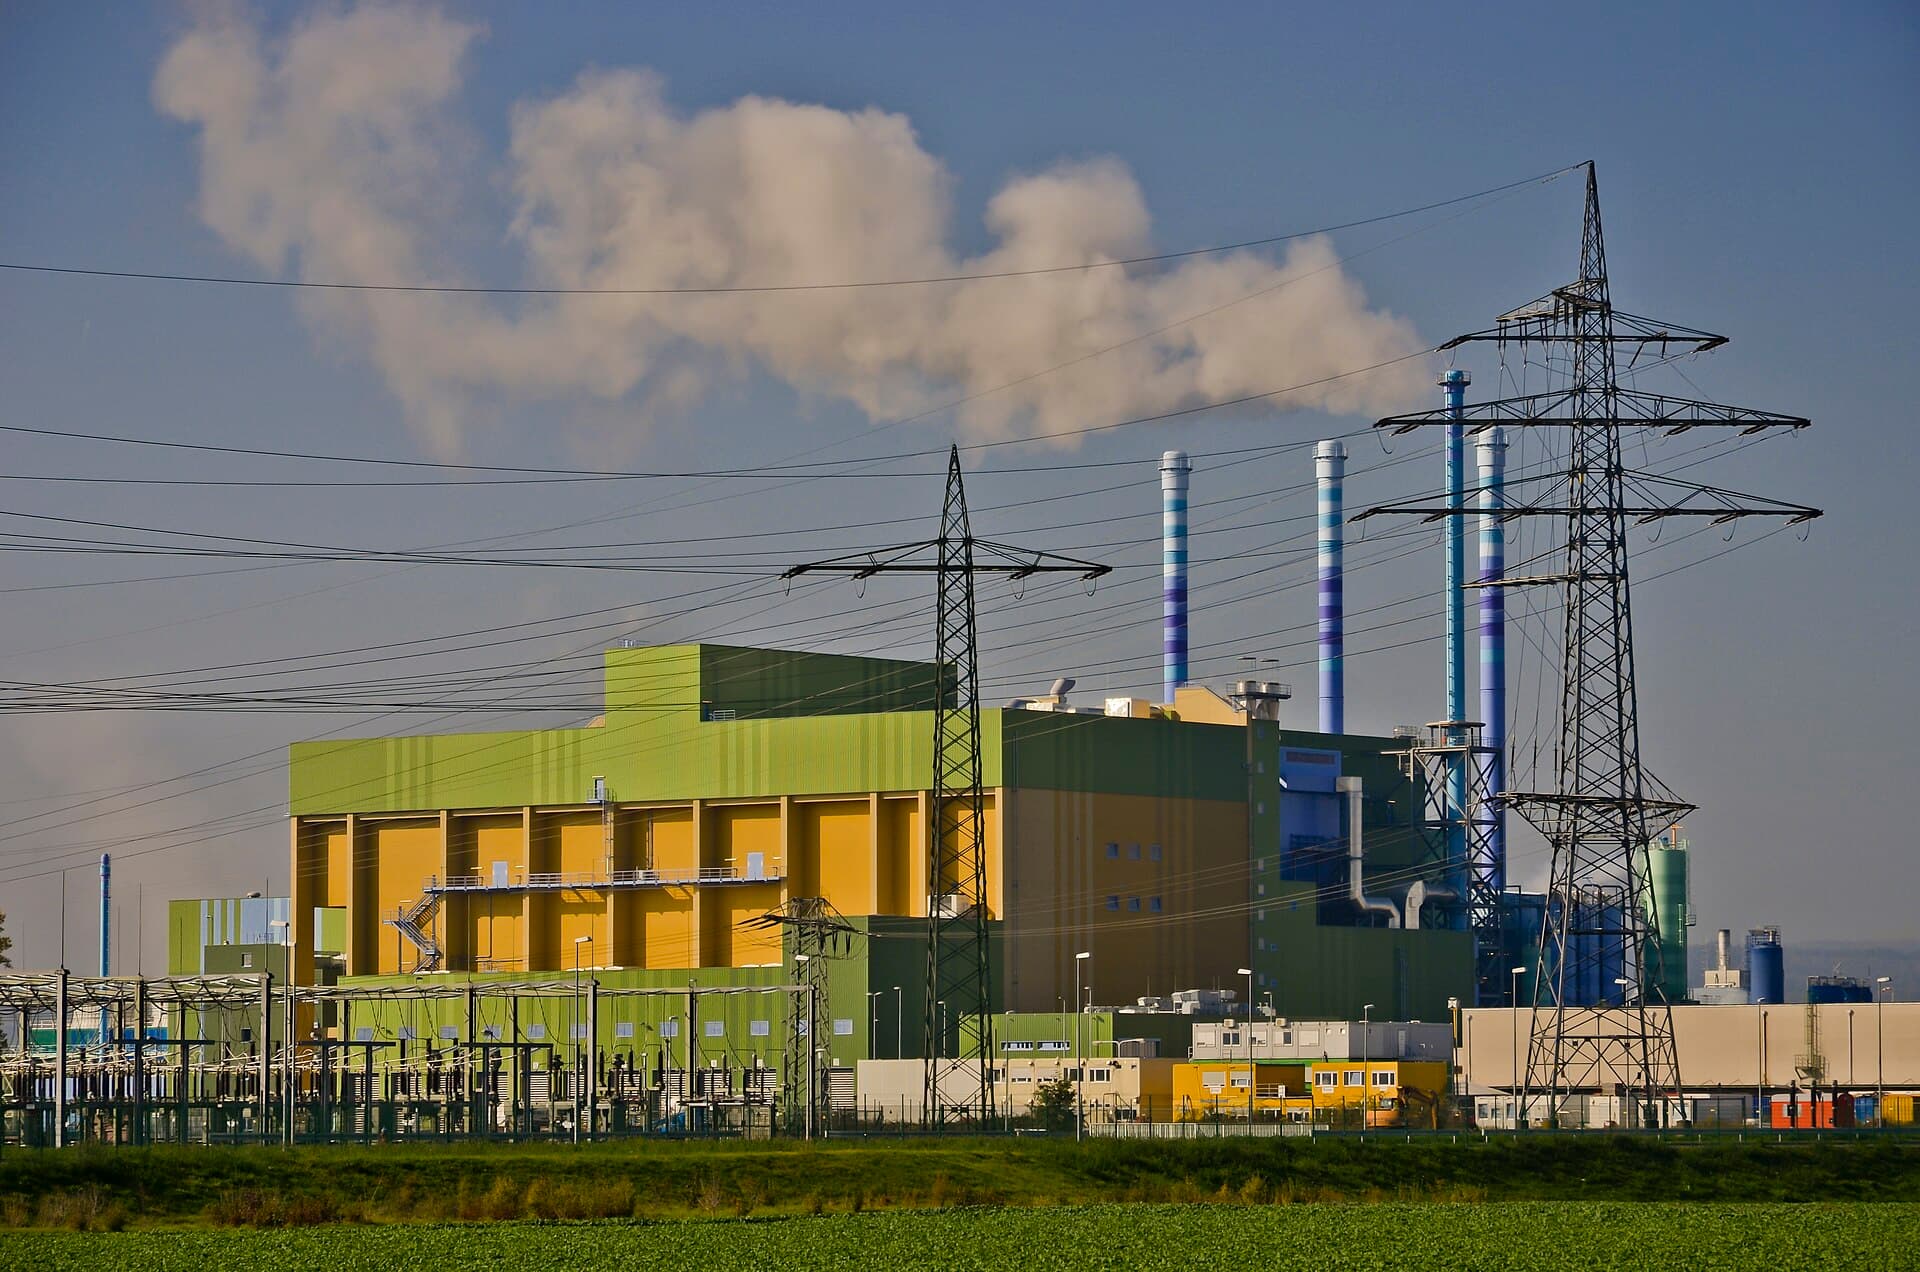
Waste and recycling
Bunker fire risk, grab crane and boiler condition, and the emissions record — on a plant whose feedstock is different every hour and never specified.
The one plant that cannot specify its own feedstock
Every other process plant knows what is going into it. A waste plant does not: the feedstock arrives on a lorry, varies by season, by day of the week and by whatever the public happened to throw away, and it contains things that should not be there — lithium batteries, gas cylinders, engine blocks. That variability drives everything. It drives bunker fires, which are the sector’s defining loss. It drives grab crane duty, refractory wear and boiler fouling. And almost none of it is recorded against the asset, so a plant that burns a different fuel every hour is maintained on a schedule written as if it did not.
Four failure modes, and what each one costs you late
The first is the one that closes plants and ends insurance relationships. The rest are the ordinary consequences of burning something nobody specified.
Bunker and pile fire
- How it shows
- Self-heating in an undisturbed quadrant, smouldering, batteries in the feed
- What it costs late
- The defining loss in this sector: months offline, and an insurer who now prices you differently
- What catches it
- Thermal watch on the pile read against the crane log, so residence time and temperature meet
Grab crane and materials handling failure
- How it shows
- Rope, grab and rail wear, drive temperature, duty far above design assumption
- What it costs late
- No crane means no feed, and no feed on an EfW plant means a shutdown within hours
- What catches it
- Thermal and duty read against the machine, with grab cycles counted rather than estimated
Emissions and abatement drift
- How it shows
- Abatement performance trending, bag filter condition, stack observation
- What it costs late
- A permit breach is a regulatory event with a public reporting duty
- What catches it
- Abatement trend against the asset, with the evidence held where the permit report is built
Fouling, refractory and throughput loss
- How it shows
- Boiler fouling rate rising, refractory loss, capacity quietly falling short of design
- What it costs late
- Gate fee revenue lost every hour, and an unplanned outage to clean
- What catches it
- Thermal on the boiler and fouling rate tracked against feed characteristics
Severity here is how we rank the class by default, not a judgement about your site. Every threshold is set per deployment, and a mode you consider routine can be dropped down the ranking on day one.
Six functions, on your plant
Everything above is your problem. These six are ours: what the layer actually does to a plant whose feedstock nobody controls.
Watch the pile, by quadrant
Continuous thermal on the bunker divided into quadrants, so a temperature has a location and can be handed to a crane driver as an instruction.
Read residence time from the crane
Grab movements per quadrant turned into how long each part of the pile has sat undisturbed, which is the variable self-heating actually depends on.
Hold abatement against the asset
Emissions and abatement performance bound to the plant producing them, so a trend has an asset and a maintenance history behind it.
Track wear against a variable feed
Refractory, grate and screen wear read against what has actually been burned, rather than against a schedule written for a fuel this plant never receives.
Hold the plant register
Machine, duty, peer group, spares and history against the asset, so a finding arrives with its context attached.
Assemble the permit evidence
Monitoring, incidents, findings and completed work exported together in the form the regulator and the insurer both ask for.
A hot spot in the quadrant nobody has turned for nine days
Self-heating in a waste bunker is entirely predictable from residence time, and residence time is sitting in the crane log. The finding is that nothing was reading the thermal picture and the crane log together.
Self-heating developing in the north quadrant
EfW line 1 · bunker · north
- peak
- 68 °C in the pile
- confidence
- 0.93
- undisturbed
- 9 days
- permit limit
- 7 days residence
Escalated to the shift manager to turn the pile
Fire risk is above the autonomy limit and reaches a person on shift, not a work queue. The escalation carried the thermal frame, the nine days of crane inactivity and the 2023 fire in the same quadrant.
Identifiers and values are illustrative.
From the bunker to the plant
It starts at the bunker, because that is where the largest loss lives and where the join between a camera and a crane log can be proved in a fortnight.
Connect plant control and the crane log
Read-only from the plant control system, the crane log and the emissions monitoring output. Nothing is written back until you ask for it.
Instrument the bunker
Thermal coverage of the bunker divided into quadrants, plus a survey pass over the boiler house, sorting lines, roofs and stacks.
Run the cadence
Continuous on the bunker, quarterly thermal at load on the boiler and handling plant, annually on stacks and structure.
Widen across the estate
Classes, quadrants and escalation defaults are set. The second line and the transfer stations are configuration.
Six things that land on your side
Artefacts, not access. Everything here exists in your systems and your formats whether or not anybody opens ours.
Bunker thermal record
Temperature and residence time by quadrant, with every detection and the action taken.
CSV · dashboard
Fire risk incident trail
Detections, escalations, response times and outcomes, in the form an insurer asks for.
PDF · ZIP
Plant thermal survey
Boiler, grate, cranes and conveying plant with delta against peers and duty at capture.
PDF · CSV
Wear and fouling trend
Refractory, grate and screen wear against what has actually been processed.
CSV · dashboard
Stack and structure survey
Stacks, ducts, roofs and platforms with condition and the frame behind each finding.
PDF · GeoTIFF
Permit evidence pack
Monitoring, incidents, findings and completed work exported with provenance intact.
PDF · ZIP
Formats are the common case; the exact shape is agreed per deployment.
How often, and what for
The bunker is the exception to everything else on this site: it is not surveyed on an interval, it is watched continuously, because the failure mode it carries develops in days.
- Bunker and tipping hallTypical cadenceContinuous thermal watchWhat the pass looks forSelf-heating, residence time by quadrant, smouldering, ignition sources in the feedReferenceInsurer · site fire plan
- Boiler and grateTypical cadenceThermal quarterly, at loadWhat the pass looks forRefractory loss, casing hot spots, fouling rate, grate and ram conditionReferenceEN 12952
- Sorting and conveyingTypical cadenceThermal twice a yearWhat the pass looks forDrive, bearing and gearbox hotspots, belt and screen wear, structure conditionReferenceManufacturer
- Stack and abatementTypical cadenceAnnually, monitoring continuousWhat the pass looks forStack and duct condition, bag filter and scrubber performance, platform accessReferenceIndustrial emissions permit
These intervals are the starting points the standards describe, not a measured result of ours. Insurers, warranty terms and your own history will move them, and the point of planning from condition is that the interval stops being the thing that decides.
Four modules, one plant
This is the sector where the join between imagery and telemetry does the most obvious work, because the thermal picture of the pile is meaningless without the crane log beside it.
Detect
Watches the bunker thermally and surveys the boiler house, sorting lines, roofs and stacks.
Leaves behind
Self-heating detections by quadrant, and classified condition on plant and structure
Analyse
Connects to plant control, the crane log and the emissions monitoring system, and resolves each onto an asset.
Leaves behind
Residence time, grab duty, fouling and abatement history readable per asset
Operations
Holds the asset register, the permit conditions, the maintenance history and the incident record.
Leaves behind
The work order, the permit evidence and the incident trail
Decide & act
Escalates fire risk to a person on shift and schedules everything else into the outage.
Leaves behind
Shift escalations with the frame and the crane log, and ranked outage scope
- 01O-EYEDetectInspection & digital twin
- 02O-ARCAnalyseSensors, IoT & telemetry
- 03O-OPSOperationsThe system of record
- 04actsO-AGENTDecide & actThe agentic layer
Every action writes back to the record, so the model sharpens with every job.
Questions
How do you watch a bunker continuously? Is that a drone?
No. A bunker is watched by fixed thermal cameras on the crane rail or the hall structure, feeding the same asset model as everything else. The aerial work here is roofs, stacks and the external plant. We would rather name the right tool than sell one tool for everything.
Can it spot a lithium battery in the feed?
Not reliably in a tipping hall, and anyone promising that is overselling. What it does is detect the consequence early — self-heating in a quadrant — and tie it to how long that quadrant has sat, which is the part that is currently nobody’s job.
Does this integrate with our emissions monitoring?
It reads from it. Continuous emissions monitoring is a regulated, certified system and stays exactly where it is. O-ARC reads its output so abatement trend sits beside asset condition, and O-OPS holds the evidence where the permit report is assembled.
Would an agent ever act on a fire risk finding?
It escalates, immediately, to a person on shift. It does not open a work order and wait. That default is deliberate and not configurable downward.