
Solar
Thermal and RGB inspection across millions of modules, tied to inverter and string-level telemetry, so a hotspot is triaged against what it actually costs in yield.
A hotspot is cheap to fix and expensive to find
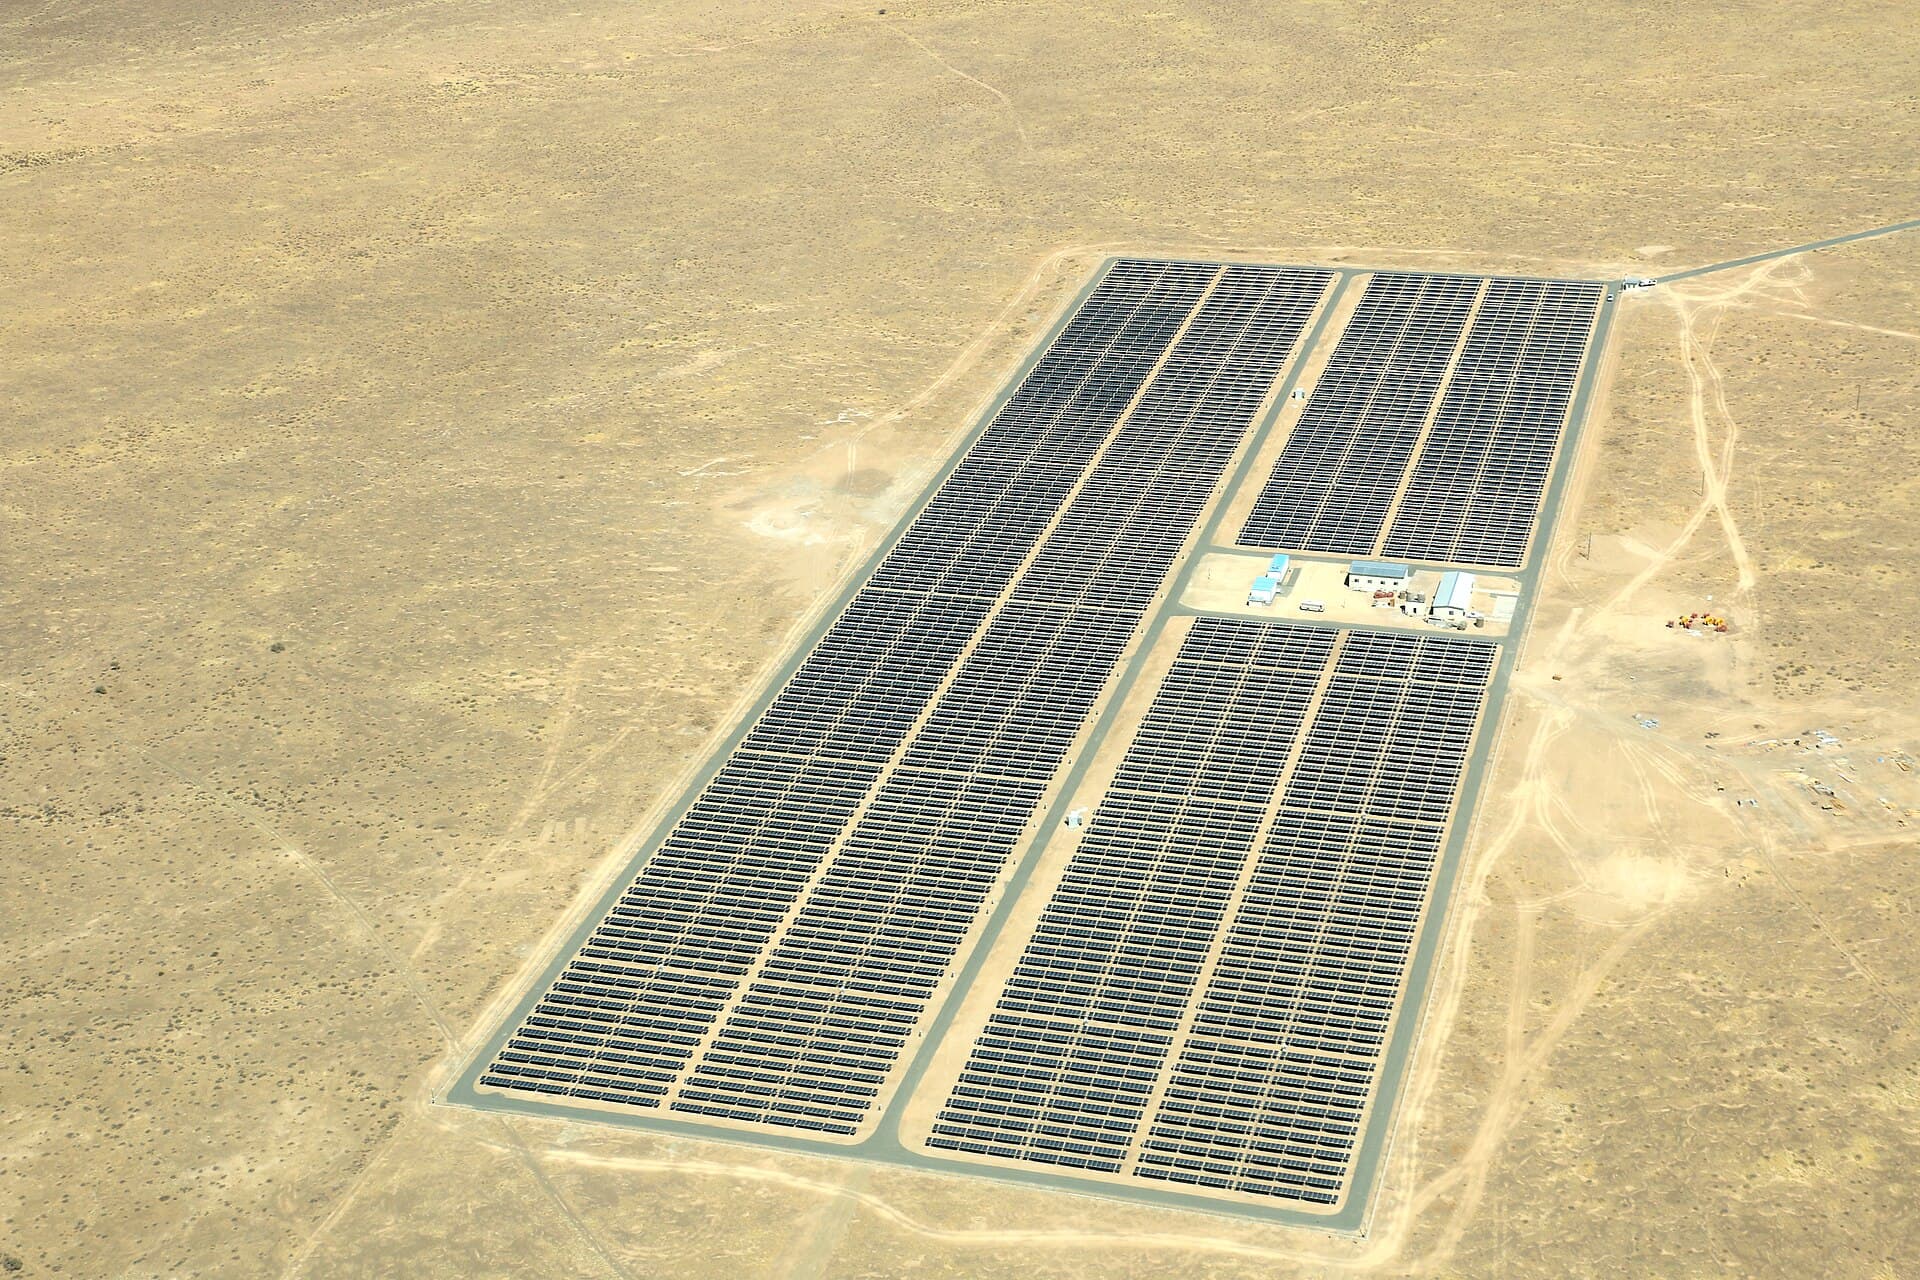
A 200 MW plant is roughly half a million modules. The failures that matter are individually trivial, a bypass diode or a string that stopped reporting, and collectively they are the gap between the yield in the model and the yield on the invoice. The problem was never repair cost. It is that finding them means either walking the site with a handheld camera or reading an inverter dashboard that says a string is down without saying which module.
Half a million modules, and the one that matters
Pick a block and switch the band. In visible light almost everything looks fine. In thermal, the diode failure, the dead string and the degradation gradient appear. That is not a demo trick, it is the reason a thermal pass exists.
B11 · 1,240 modules
Nothing outstanding
- asset
- B11
- confidence
- —
- delta T
- —
- peers
- 24 strings
Nothing above the bar for this block on this pass. It drops down the plan for the next one, which is how flight time gets spent where it pays.
Blocks, identifiers and values here are illustrative and show the shape of a real read rather than a customer's plant. What is real is the behaviour: a class that only appears in one band, corroboration from string current before anything is raised, and two blocks with nothing wrong.
Four failure modes, and what each one costs you late
Named the way a PV operator names them. If the first row does not match what you actually chase, tell us and we will stop talking.
Bypass diode failure
- How it shows
- A whole substring runs hot in thermal, typically 15 to 25 K above its neighbours
- What it costs late
- Output lost on that substring until somebody happens to look, often a full season
- What catches it
- The thermal pass classifies it and attaches it to a module id, then string current confirms it
String or substring outage
- How it shows
- Current on one string diverges from the others on the same inverter
- What it costs late
- The inverter keeps reporting, so the loss hides inside plant-level availability
- What catches it
- O-ARC sees it in telemetry the same day, and the next flight is planned over it
Potential-induced degradation
- How it shows
- A gradual, position-correlated drop, worst nearest the string's negative end
- What it costs late
- Compounds quietly for years and gets blamed on soiling or the degradation curve
- What catches it
- Comparison against the same modules in earlier passes, which is why versioned capture matters
Soiling and vegetation shading
- How it shows
- Uniform loss across a block, or shadow patterns that move through the season
- What it costs late
- Cleaning done on a calendar rather than where it pays back
- What catches it
- The RGB pass ranks blocks by soiling, so the crew starts where the loss is
Severity here is how we rank the class by default, not a judgement about your site. Every threshold is set per deployment, and a mode you consider routine can be dropped down the ranking on day one.
Six things the layer runs on a PV plant
Not features in general. These are the functions that execute against your blocks, strings and modules, in the order they happen.
Plan the pass from what changed
Blocks that drifted since the last flight, strings the inverter flagged, anything skipped for weather. The route is built over those rather than over the whole site on a calendar.
Classify down to the module
Not a hotspot on a map. A class, a confidence and a module id, so the finding is an identifier the rest of the platform can act on rather than a picture somebody has to interpret.
Corroborate against the inverter
String current for the same window, compared against the other strings on the same inverter. What two sources agree on outranks what one of them saw.
Rank by lost yield, not by count
Two hundred findings sorted by what they actually cost this season, weighed against warranty state and how long each fix takes.
Raise the work inside your limits
Under your threshold it goes out with the frame, the trace and the part number attached. Above it, it stops and asks a person, with the same evidence.
Track degradation across passes
The same modules compared pass to pass, so PID and gradual loss appear as a trend instead of being absorbed into a degradation curve nobody checks.
A hotspot found on Tuesday, fixed on Thursday
The pass was planned over the blocks that had drifted since the last one. The finding was checked against string current before anything was raised, and the asset's own warranty and parts position decided whether it went out at all.
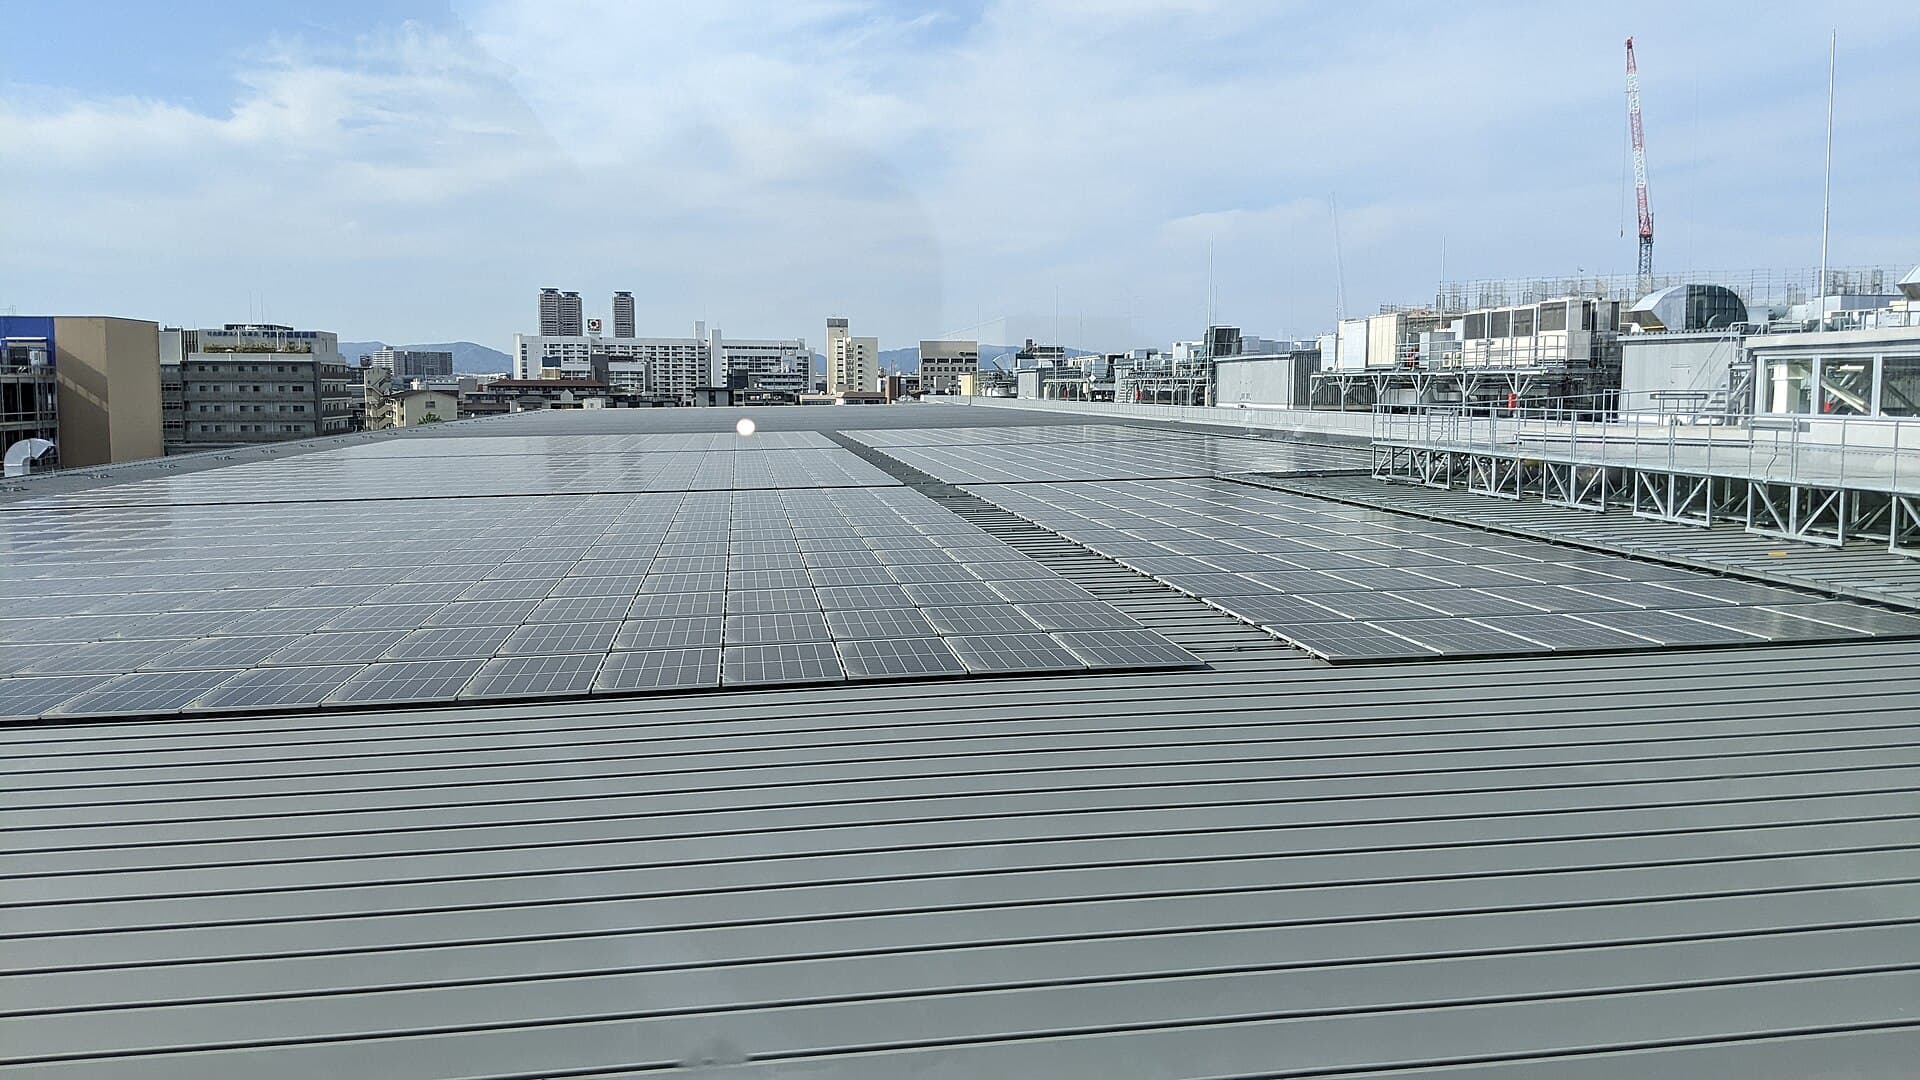
Bypass diode failure, string 14
B13.S14.M07
- confidence
- 0.94
- delta T
- 21.4 K
- corroborated
- string current
- standard
- IEC TS 62446-3
Dispatched inside the standing limit
Corroborated, in warranty, part on the shelf and under the labour threshold for this site, so it went without waiting for the Monday meeting.
Identifiers and values are illustrative.
How a solar deployment starts, and then repeats
Four steps. The first is the slow one, because it depends on your access rather than on us.
Connect the plant
Read-only into your SCADA or inverter portal, plus the module register if you hold one. A single outbound connection from inside your network, reviewed by your team before anything is installed.
Fly a baseline
One thermal and RGB pass over the whole site, mapped onto the block, string and module hierarchy. This is the pass every later one is compared against.
Run the cadence
Thermal twice a year and RGB quarterly to start, then adjusted by what the last pass and the telemetry actually found. Findings land ranked, with evidence, in the system you already use.
Widen the limits when the record earns it
The agent proposes everything at first. Limits open on the specific classes where the record shows it was consistently right, one class at a time, at your pace.
What lands on your side after a pass
The functions above produce these. Formats are open, and the export is yours whether or not you keep using us.
Geo-referenced orthomosaic
The whole site at survey fidelity, versioned per pass and tied to the block, string and module hierarchy.
GeoTIFF · web viewer
Thermal orthophoto and defect layer
Every classified anomaly attached to its module, carrying its class, confidence and temperature rise.
GeoTIFF · GeoJSON
Ranked finding list
Sorted by lost yield against warranty and parts position, not by how many detections fired.
CSV · API
Work orders with evidence
Raised in O-OPS or written into the maintenance system you already run, with the frame and trace attached.
O-OPS · SAP · Maximo
String and inverter series
The telemetry each finding was corroborated against, kept beside it rather than in a separate historian query.
API · historian
IEC 62446-3 report pack
The survey written up in the form your O&M contract, insurer or lender asks for.
PDF · signed
Everything here is produced per pass and kept versioned, so the second year of a programme is worth more than the first. Nothing is locked in a viewer: if you leave, the imagery, the findings and the series come with you.
How often, and what for
A starting point anchored to the standards, not a rule. Insurers, warranty terms and your own history will move it.
- Modules and stringsTypical cadenceThermal twice a year, RGB quarterlyWhat the pass looks forHotspots, diode and cell failures, PID, cracked glassReferenceIEC TS 62446-3
- Inverters and combinersTypical cadenceThermal twice a year, telemetry continuousWhat the pass looks forConnector hotspots, fan and filter condition, string imbalanceReferenceIEC 62446-1
- Trackers and mountingTypical cadenceQuarterly, plus after high windWhat the pass looks forMisalignment, motor failure, pier movement, torque tube damageReferenceManufacturer
- Site and civilsTypical cadenceQuarterlyWhat the pass looks forVegetation, erosion, drainage, fence and access conditionReferenceISO 55001
These intervals are the starting points the standards describe, not a measured result of ours. Insurers, warranty terms and your own history will move them, and the point of planning from condition is that the interval stops being the thing that decides.
All four modules, on a PV plant
Solar is the sector where corroboration pays most, because the array is instrumented and the inverter already knows something the camera does not.
Detect
Flies thermal and RGB over the array and classifies what it finds down to the module.
Leaves behind
Versioned thermal and RGB passes, with every anomaly classified to a module id.
Analyse
Reads inverter and string telemetry, so a thermal signature is confirmed or contradicted by current.
Leaves behind
String and inverter series aligned to the same assets, and the corroboration verdict per finding.
Operations
Holds the module register, warranty state and the work already open on that inverter.
Leaves behind
The module register, warranty state, parts position and work history per inverter.
Decide & act
Plans the next pass from drift and weather skips, ranks findings, and raises work inside your limits.
Leaves behind
The next flight plan, the ranked list, and a decision record for every action taken.
- 01O-EYEDetectInspection & digital twin
- 02O-ARCAnalyseSensors, IoT & telemetry
- 03O-OPSOperationsThe system of record
- 04actsO-AGENTDecide & actThe agentic layer
Every action writes back to the record, so the model sharpens with every job.
Questions from this sector
How much of a plant can one flight cover?
It depends on module count, ground sample and whether you need thermal, RGB or both. A single-pass thermal survey of a few hundred hectares in a day is normal for the aircraft in service. We would rather scope against your site than print a hectares-per-day figure that assumes conditions you may not have.
Does thermal need particular conditions to be valid?
Yes, and the standard says so. IEC TS 62446-3 sets minimum irradiance and wind conditions for a valid thermographic survey. The planner schedules against forecast rather than against a date, which is one reason flights get re-planned rather than simply repeated.
Can you tell a diode failure from a cracked cell?
Usually, because the signature differs: a bypass diode takes a whole substring hot, a crack is local and irregular. Confidence is reported per finding, and anything under the bar you set for that class is proposed for review rather than actioned.
We already get an annual thermography report. What changes?
The report becomes a record. Findings attach to modules rather than to page numbers, this year's pass can be compared with last year's on the same modules, and the findings the inverter data agrees with rank above the ones only the camera saw.